Author: Sierra

  • Why you need a why map

    Why you need a why map

    Have you ever been working on a project and wondered ‘why are we doing this’? You’re not alone. I always wonder about that.

    Many times, stakeholders have an outcome in mind that they are expecting, but since they have a solution in mind as well, they skip over explaining what the goals of the project are. But, don’t be discouraged. Here’s a simple way to help you uncover the ‘why’ behind the ‘how.’

    Enter Why Maps

    Why maps are a way to ask ‘why’ over and over and over and map out your thought process as you do it.

    Why maps are simple in concept: Start with your project and ask ‘why’ – why are we doing this project? Then ask why to the answer you gave. Keep doing this until you question the nature of reality. Don’t ask how, or who, or what, only ask why.

    Ask the obvious: Why are we doing this project? Why do we need engineering resources to build this? You’ll know the answer, but the ‘whys’ you ask to those answers may be what open up a better understanding of the project needs.


    I think of it like uncovering a video game map – there won’t be a stash of ammo and stimpaks in every area, but you’ve gotta check out those parts of the map to know for sure. And eventually, you’re going to find something really useful.

    Making your map

    I use Miro to create my why maps, using colored sticky notes to denote questions (always starting with why), answers I know for sure, assumed answers, and unknown answers.

    My why maps look like this:

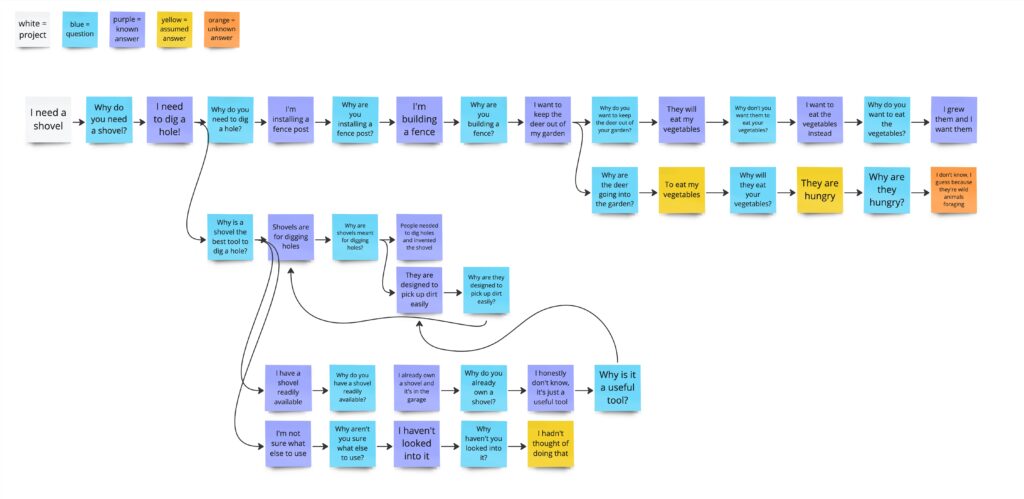
    They help to visually demonstrate where you have a deep understanding of the project, and where there are assumptions and unknowns. The bigger your why map gets without any assumptions or unknowns, the better you understand the project. The smaller the map, the less you know. Easy!

    This allows you to explore the project and get a list of crucial questions to ask in 20 or 30 minutes. You can show your map to your stakeholders and show them where you need additional info, and maybe even get some ‘why’ questions from them as well.

    An Example on How to use Why Maps

    Let’s walk through an example of how a why map can be powerful.

    Here’s the scenario from the why map image above:


    I say ‘I need a shovel’

    You say…

    ‘Why do you need a shovel?’

    To dig a hole in my yard

    >

    Why do you need to dig a hole in your yard?

    >
    I’m installing a fence post

    >

    Why are you installing a fence post?

    >

    I’m building a fence, duh

    >

    Why are you building a fence?

    I’m trying to keep deer and creatures out of my garden

    >
    Why are you trying to keep deer and creatures out of your garden?

    Why do deer and creatures come into the garden?

    I don’t want them to eat my garden plants

    They want to eat my plants

    >

    Why do deer eat garden plants?
    Why do you want to keep the deer from eating the plants?

    >

    They are hungry and it’s easy food

    I want to eat the food instead!

    >

    Why are the deer hungry?

    Why is it easy to get the food?
    Why do you want to eat the food?
    >

    I’m not sure, I guess because deer are wild animals who can’t farm

    The food is just sitting there, unguarded 

    I grew it, I want it!

    Now we get into the space where we are questioning things that are pretty foundational. We can keep going, but we now have a much better idea of why the shovel is needed! And you understand that my real goal is keeping animals from eating my garden. You can help me solve that problem now, instead of just handing me a shovel and then having me get frustrated with you when…

    The shovel isn’t really what I need. A post hole digger would be better. A dirt auger would be even better. Or I could opt for a fish line fence, which is often all you need to keep deer away. I could plant a sacrificial crop of something deer and creatures love to distract them from my garden. I could spread blood meal and predator urine to scare the creatures off. I could opt for container gardens on my deck where the animals won’t eat them. I could do a few of these things! There’s so many options!

    This comes from a real-life scenario where I was putting up a fence for my garden, and had a really hard time digging up the stony dirt to get the posts in. I ended up using a whole variety of tools to get the job done, and none of them were a shovel. This is why it’s so crucial not to assume you know what is needed without fully understanding the situation the solution exists in.

    In Conclusion

    I have many times been asked to design a feature without understanding the ‘why’ behind it, and often once I uncover the effect the feature is meant to have, the solution changes entirely. I was once asked to combine two screens together to make navigation easier for users – but when my team looked into why users were having trouble with this screen, we uncovered an entirely different workflow that was slowing people down. All users needed was a button to download some information, not an entirely reworked experience. This solution ended up saving a lot of time and effort, and met the user’s needs much better than changing the screens would have. And it was because my team asked ‘why.’

    Ideally when you make a why map, everything makes sense and the solution you’re asked to design is exactly what is needed. Then a why map becomes a way to quickly find out where you need to get up to speed on the project, and you can take a few minutes to ask any outstanding question you have about the work instead of slowly uncovering these over the course of the entire project. 

    But you may also uncover the real reason behind the task and discover better solutions to the core problem. Uncovering the reason behind the proposed solution also allows you to more quickly test the solution, and prove out whether or not it will meet the project’s needs. 

    So get out there and ask why!

  • How (and why) to track your UX process maturity

    How (and why) to track your UX process maturity

    There are a whole lot of articles with a whole lot of questionnaires all promising to put a number on whatever business processes we deem important. A questionnaire like this is a great first step for gauging where your business is, how it stacks up against others, and where you might like to go next.

    I put together this formula for tracking UX process maturity after sending the NN Group UX maturity survey to my boss and a few others in leadership at my company. I was the UX manager, and wanted to gauge how people were thinking about UX, and see if we were on the same page with our understanding of what UX was doing vs what we could be doing. The maturity survey was a good first step. 

    But it was just the first step. After gauging our overall UX maturity, we needed to figure out what the next step on UX maturity looked like for us, and what actions we needed to take to get there. And once we did that, we needed to understand if those actions were getting the outcomes we expected.

    Enter, UX process maturity tracking.

    What is UX process maturity?

    Simply put, UX process maturity is how consistently your team is completing all the activities in your UX process for each project you work on. Low maturity means your process is not followed that consistently, and high maturity means that the process is used in the same way on every project.

    It’s easy for people to overestimate how mature a UX practice is, and it’s also often difficult to really know what a mature practice even looks like or why you would want one. To understand your overall maturity, ask your UX team to fill out the NN Group UX maturity questionnaire, and share their results. Send this questionnaire to others on teams you frequently work with and get their results too. Averaging these answers together should give you a good sense of where your UX stands.

    Monitoring process maturity is going to be most helpful if your team is at stage 2-4 on the NN Group UX maturity scale. These are the stages where defining a UX process and focusing on its repeatability is going to give you the most impact, since at these stages UX is still finding its footing at the company. These are also the stages where most UX teams find themselves.

    When I started tracking process maturity with my team, we wanted to get from a solid 3, maybe almost a 4, on the NN Group UX maturity scale, to a solid 4. I tracked the UX process across individual projects to quantify if we were hitting that ‘repeatable’ element of maturity.

    Why track your process maturity?

    Tracking this process maturity was popular with my team, as it gave them a clear metric to shoot for. And honestly, it makes doing UX activities feel more official – after all, there’s a number attached to them.

    For my team, having a well-defined process monitored by this metric was a motivator. We were able to see that we were making progress – something that is often hard to get a sense of if UX maturity efforts span years. The team was able to see that year over year, we were getting better at following our process, and identify where we wanted to focus on improving. 

    Process maturity is also a fast way of showing that the discipline of UX is improving at your organization. While having real product outcomes is the best way to prove UX value, being able to quickly show that you are continuously improving the ways you get those outcomes is also useful.

    And consistent UX process breeds overall UX maturity. If you follow a process that produces results, people will see how UX can be valuable and you will have the data to go out and show people the impact UX is having.

    It is important to note that UX process maturity is not identical to overall UX maturity as a whole. While UX maturity looks at the overall impact UX is having on an organization and how efficiently that impact can be made, UX process maturity tracks how well you are doing the steps in your UX process. Process maturity is one part of UX maturity and can be a good indicator of if it’s time to start working on larger UX initiatives or if repeatability and process is the place to focus.

    How to track UX process maturity

    Let’s break down how to set up your process maturity tracking, step by step.

    Define the Ideal UX Process Steps

    Figure out where you want to go. I did this by created a list of all the steps that make up our ideal UX process—everything from user research to testing and iteration.

    Audit your Existing UX Process

    Take a look at the tasks you do today, regardless of how frequently they happen, and document them.

    Define your Maturing UX Process

    Look at the deltas between your ideal process and your existing process, and decide where to focus. Don’t try to make the leap from existing to ideal all at once. Instead, choose a few key areas to focus on improving that will move you closer to your ideal process.

    Track Each Project

    I built a spreadsheet that tracked each project across these steps, marking whether each step was:

    • Done (D)
    • Not Done (N)
    • Kinda Done (K)
    • Unneeded (U)
    • Abandoned (A)

    As each project progressed, I marked down the steps that were completed. At the end of the project, I marked down any steps that weren’t complete as either Not Done or Unneeded. 

    Sort of Done exists because sometimes you give it your best shot, but it just doesn’t quite work out. It’s important to account for this and not trap yourself in an artificial binary of done/not done.

    Abandoned exists to track if a project is canceled and when. If a project is shelved, any incomplete steps get marked as abandoned. I then track how many projects got abandoned, as well as how many steps in each project remained incomplete at the time of abandonment.

    Quantify Process Maturity

    For each project, I used a formula to calculate a maturity percentage:

    • Formula: (C + (K/0.5) + U) / Total Steps

    This gives full credit for completed and unneeded steps, half credit for “sort of done,” and no credit for incomplete steps.

    Each project’s maturity is expressed as a decimal between 0 and 1, representing 0% and 100% maturity.

    In the spreadsheet, I track the project’s total maturity, whether or not it was abandoned, whether or not it is completed, if deadlines were missed, if there were issues with project direction, and if research and reporting was done after the project launched. The last three items are specifically things I wanted to keep an eye on at my organization. You can switch these up for things you are interested in tracking if needed.

    Analyze Results

    Without a baseline, metrics are largely useless. They don’t mean anything if you don’t know if, say, 40% is higher or lower than usual.

    I took all the projects we did in the previous year and filled out the maturity spreadsheet for them to get a baseline of what our process maturity was like.

    Then, when I started putting in the current year’s projects, I was able to see if the project process was ranking better or worse than previously.

    There’s a couple of interesting metrics to look at. 

    Overall maturity percentage 

    Higher is better. High maturity means your UX process is repeatable and in use by everyone on the team.

    Gap between the most mature and least mature projects

    You want the gap to be small, meaning you are consistently using the process for most projects. 

    Number of abandoned projects

    This isn’t good or bad on its own. Maybe you try a lot of things, prove out their usefulness or not using UX research, and shelve the ones that don’t make sense to keep working on. The key thing is how far down the pipeline the projects got before getting abandoned. Ideally, you’re shelving projects pretty quickly if they aren’t panning out, not spending a lot of UX resources only to not follow through on building the project. 

    Which steps are being skipped most often in the process

    This can help you decide if they are unneeded or if something is getting in the way of them happening.

    A word of warning: Don’t use this maturity tracker to figure out who’s doing a bad job or judge anyone’s work product. This is a great way to tank morale, and it’s unfair. If you notice that all the projects one person is working on have low process maturity, it’s probably not all that person’s fault. There are probably other forces at work that are making it difficult to do all the process steps. You need to jump in and uncover what the problems really are, not just blame the lack of maturity on someone and move on.

    In Conclusion

    UX process maturity tracking provides a clear, actionable framework for teams to measure how consistently they follow their UX processes and identify areas for improvement. This can motivate teams by showing their progress over time and strengthen the organization’s overall UX maturity by demonstrating the value of a structured and reliable process.

    I hope this article has been valuable! Try out UX process maturity tracking in your organization and see what you uncover!

    Key Takeaways:

    • Data-Driven Insights: Tracking maturity gives you a standard, quantifiable way of seeing where your process maturity is
    • Team Empowerment: Showing progress project by project and year over year helps motivate teams to keep doing better and better work
    • Long-Term Vision: Demonstrating process maturity can help lay the groundwork for greater UX buy-in and maturity across the organization.
  • 14 design terms to add to your vocabulary in 2025

    14 design terms to add to your vocabulary in 2025

    Let’s ring in the new year with some design terms I think we need in the year of our Lord 2025. 

    These terms describe various situations and types of design you might find yourself dealing with as a UXer or product designer. I don’t think there’s a lot of terms to describe these situations, so to remedy that, here’s my list of new design terms for 2025.


    Rude Design

    When the design is ugly and bad, but it’s getting the results you want so you don’t fix it. Bonus points if you just keep adding stuff to the design so it gets more and more cluttered.


    Sneaky Design (bad)
    When you do sneaky stuff like signing people up for subscriptions in a way you think they won’t notice or making it hard to cancel subs. Just stuff that’s manipulative and will make users be like 😐 if they realize.


    Sneaky Design (good)
    When you do stuff behind the scenes to improve the user experience, like saving info the user has previously entered and prefilling things for them. Or wizard-izing complicated workflows to make them easier to do.


    Lipstick Design

    When you do your best to make it better, but it’s just putting lipstick on a pig.


    UX UI Design

    No / between UX and UI. This is UI design by people who are just UX designers so it looks like a wireframe. It’s no-frills and super functional without being beautiful.


    Redneck Design

    When you design something stupid, but it works. When you design something unexpected and kinda ugly which is actually a big improvement for users. Common in design for legacy software. The name comes from r/redneckengineering


    Good Bad Design

    When it looks like a 90s website/is hideous, but the UX is great.


    Bad Good Design

    When it looks slick, but the UX is garbage.


    Bad Bad Design

    It looks bad and it works bad.


    Good Good Design

    It looks good and it works good.


    A Pea

    From ‘The Princess and the Pea.’ A seemingly unimportant design detail that many people have strong opinions about. See also HiPPO (Highest Paid Person’s Opinion).


    Kobayashi Maru

    A situation where tons of legacy systems and software are all interconnected to form an ecosystem which cannot be easily altered. No matter what you design, there will be big downsides and tradeoffs. From Star Trek’s no-win scenario.


    Duct Tape Design

    Used to describe a design solution which was clearly just chosen to solve an immediate problem and wasn’t well integrated into the overall system.


    UX Bankruptcy

    When you have so much UX debt, you need to just start over.


    I hope these terms help you express your UX truth, and 2025 is a year of great communication.

    Thanks for reading!